GNSS VOD data
GNSS microwave signals are measured with GNSS antennas above and below the canopy continuously. The VOD (vertical optical depth) is calculated from the signal differences and used to derive vegetation water content and leaf area index. For further information about the processing and technique see Humprey, V. and Frankenberg, C (2023). Different examples of the GNSS processed data are shown below.
Time series
This graph illustrates the Vegetation Optical Depth (VOD) derived from GNSS signals over time, highlighting seasonal changes in the forest canopy structure and water content.

Hemispherical graph
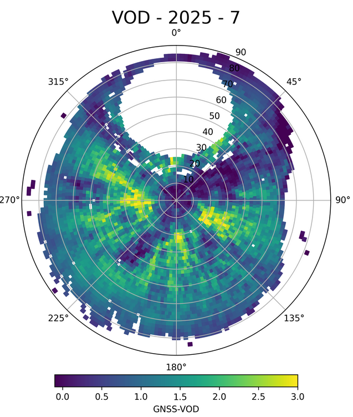
A skyplot showing the signal-to-noise ratio (SNR) attenuation from various satellites across the hemisphere. This spatial information is crucial for accurately retrieving VOD values.
Available sites
Lägern
Lägern Gnss data is measured on top of a 45m high tower and on forest floor capturing GNSS signal differences in a mixed-forest.
Show data 🡆
Davos
Davos Gnss data is measured on top of a 35m high tower and on forest floor capturing GNSS signal differences in a norway spruce forest.
Show data 🡆