Spectral Data
We measure spectral in-situ data continuously at various sites with a diverse vegetation setup. The Fluorescence Box (FloX) is a unique, weatherproof instrument designed for the passive and continuous observation of vegetation. It contains two sensors FULL (400nm-1000 nm) and FLUO (650–800 nm) to measure upwelling radiance and downwelling irradiance. The radiances and reflectance are used to derive indices, and by using the atmospheric oxygen absorption bands (O2A and O2B), the fluorescence signal is derived.
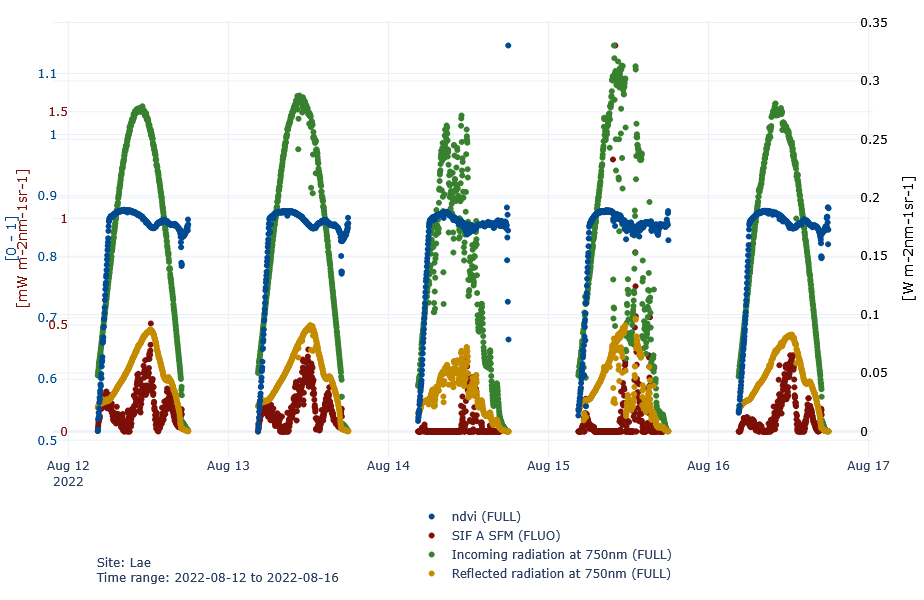
Time Series
Plotting time series of our FloX data enables a fast overview of a wide range of prepared variables such as NDVI, SIF and many mores. They can be plotted over time or with a diurnal cycle.
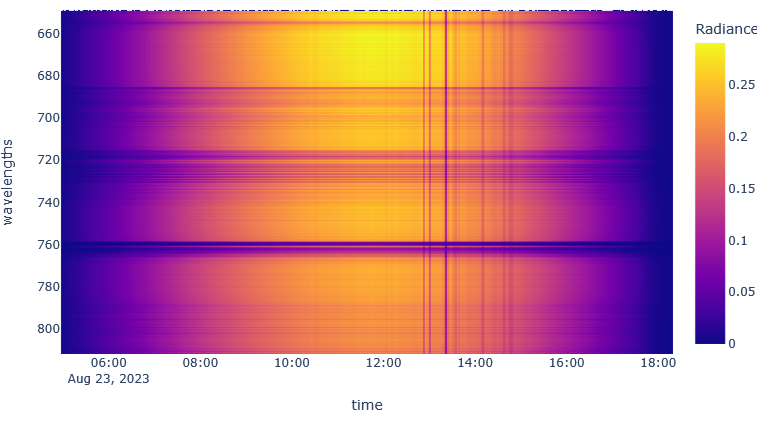
Wavelength Graph
The wavelength graph plots the processed wavelength-dependent data which contains downwelling and upwelling radiation and reflectance.
Available Sites
Lägeren
Lägeren spectral data is measured on top of a 45 m high tower capturing beech tree reflection.
Show data 🡆
Davos
Davos spectral data is measured on top of a 35 m high tower capturing norway spruce reflection.
Show data 🡆

Zurich
Zurich data is measured on from top of a building looking at a tree in an urban environment.
Show data 🡆